All elements of this simulation are licensed under Licence Creative Commons Attribution 4.0 International License.
Industrial hall with non-uniform absorption and fitting objects (comparison with experimental data)
Description
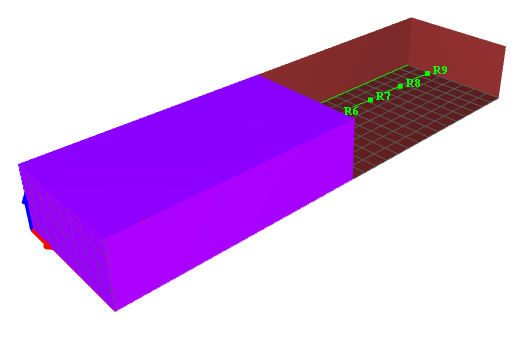
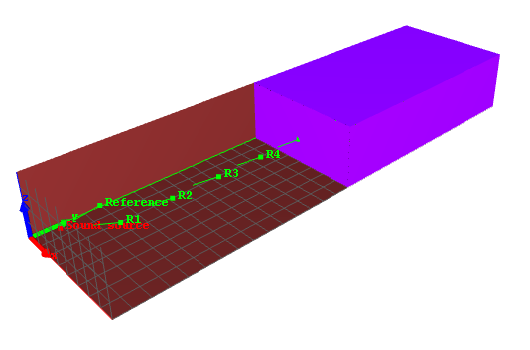
Industrial hall (8m x 30m x 3.85m) with non-uniform absorption, with a single source, 7 receivers along a line and a reference receiver. This simulation includes 3 configurations (B, C and D) with different size for the fitting zone (entire hall, left part, right part), each with specific fittings properties (mean free path and absorption).

What is tested?
Comparison between SPPS and experimental data from [Ondet, 1989].
[Ondet, 1989] Ondet, A. M. , and Barbry, J. L. (1989). “ Modeling of sound propagation in fitted workshop using ray tracing,” J. Acoust. Soc. Am. 85(2 ), 787–796. doi.org/10.1121/1.397551
Reference
CAUTION - The following results present comparisons between numerical simulations carried out with I-Simpa and 'reference' data available in the scientific literature.
- It is difficult to prejudge the concept of 'reference'. The deviation between the simulations and the reference data that can be observed do not necessarily call into question the corresponding simulations but can also be associated with other sources of deviation (modeling assumptions, numerical instabilities, experimental uncertainties, etc.).
- Note also that these comparaisons can also show the limitations of some numerical codes.
What is tested?
Comparison between SPPS and experimental data from [Ondet, 1989].
[Ondet, 1989] Ondet, A. M. , and Barbry, J. L. (1989). “ Modeling of sound propagation in fitted workshop using ray tracing,” J. Acoust. Soc. Am. 85(2 ), 787–796. doi.org/10.1121/1.397551
Description
Industrial hall (8m x 30m x 3.85m) with non-uniform absorption, with a single source, 7 receivers along a line and a reference receiver. This simulation includes 3 configurations with different fitting zone (half-left zone, half-right zone, full zone), each with fittings properties.
Reference

All elements of this simulation are licensed under a Creative Commons Attribution 4.0 International License.
Results
Configuration B
Configuration C
Configuration D
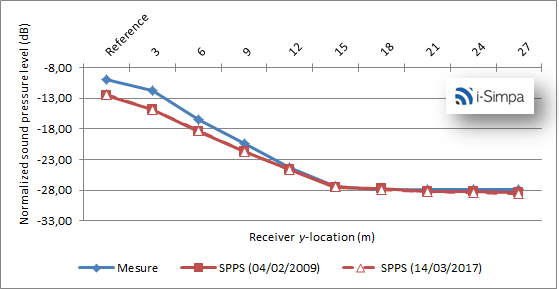
Normalized sound pressure level (configuration B)
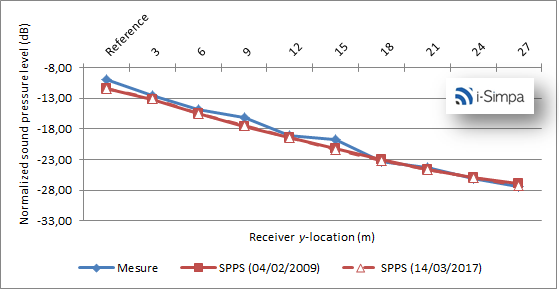
For the configuration B, the whole hall contains fitting objects. In this example, one can observe a very good agreement between SPPS results and the experimental data, with a mean deviation less than 1 dB and a maximal deviation less than 1.5 dB, which is low in regards of the measurement uncertainties.
Normalized sound pressure level (configuration C)
For the configuration C, the half-left part of the hall contains fitting objects. In this example, one can observe a good agreement between SPPS results and the experimental data, except for the first receivers, i.e. in the fitting zone. It may be due to local effects: in the real hall, fittings are located at specific location, producing specific reflection and diffraction effets, while, in the simulation, fittings are not real, but defined through probabilistic parameters. In the second part, the agreement is very good.
Normalized sound pressure level (configuration D)

For the configuration D, the half-right part of the hall contains fitting objects. In this example, one can observe, here again, a very good agreement between SPPS results and the experimental data. The mean and the maximal deviations are less than 1dB and 1.5dB, respectively.
Calculation parameters
Reference
| Parameters | Value |
|---|---|
| Active calculation of Atmospheric absorption | YES |
| Active calculation of diffusion by fitting objects | YES |
| Active calculation of direct field only | NO |
| Active calculation of transmission | NO |
| Calculation method | Energetic |
| Limit value of the particle extinction | 5.0 |
| Number of sound particles per source | 1 000 000 |
| Number of sound particles per source (display) | |
| Random initialization number | |
| Receiver radius | 0.31 |
| Simulation length (s) | 1.500 |
| Time step (s) | 0.005 |