All elements of this simulation are licensed under Licence Creative Commons Attribution 4.0 International License.
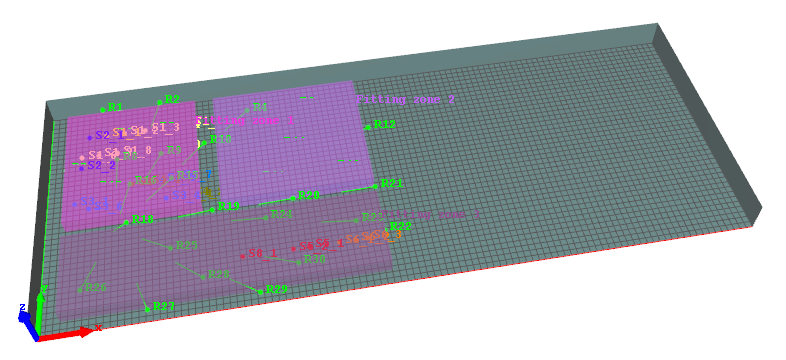
Large industrial hall with non-uniform absorption, 3 fitting zones and 30 workplace (i.e. 30 receivers)
Description
Very large industrial hall (107m x 42m x 5m) with non-uniform absorption, multiple sound sources (5 configurations: 1 (C1), 12 (C2), 22 (C3), 7 (C4) and 30 (C5) sound sources), 30 receivers. This simulation includes 3 fitting zones, with the same diffusion properties.

What is tested?
Comparison between SPPS and experimental data from [Ondet, 1988]. Additional information concerning the experimentation are given in [Ondet, 1984].
[Ondet, 1988] A.M. Ondet, J.L. Barbry, Sound propagation in fitted rooms—comparison of different models, Journal of Sound and Vibration, Volume 125, Issue 1, 1988, Pages 137-149, ISSN 0022-460X, http://dx.doi.org/10.1016/0022-460X
[Ondet, 1984] A.M. Ondet, J.L. Barbry, Prediction of noise levels in fitted rooms. Note Scientifique et Technique No. 52, INRS October 1984 (1984) (in French)
What is tested?
Comparison between SPPS and experimental data from [Ondet, 1988]
[Ondet, 1988]A.M. Ondet, J.L. Barbry, Sound propagation in fitted rooms—comparison of different models, Journal of Sound and Vibration, Volume 125, Issue 1, 1988, Pages 137-149, ISSN 0022-460X, http://dx.doi.org/10.1016/0022-460X
Description
Very large industrial hall (107m x 42m x 5m) with non-uniform absorption, multiple sound sources (5 configurations: 1, 12, 22, 7 and 30 sources), 30 receivers along a line . This simulation includes 3 fitting zones, with the same diffusion properties.
Reference

All elements of this simulation are licensed under a Creative Commons Attribution 4.0 International License.
Reference
CAUTION - The following results present comparisons between numerical simulations carried out with I-Simpa and 'reference' data available in the scientific literature.
- It is difficult to prejudge the concept of 'reference'. The deviation between the simulations and the reference data that can be observed do not necessarily call into question the corresponding simulations but can also be associated with other sources of deviation (modeling assumptions, numerical instabilities, experimental uncertainties, etc.).
- Note also that these comparaisons can also show the limitations of some numerical codes.
Results
Sound pressure level (configuration C1)

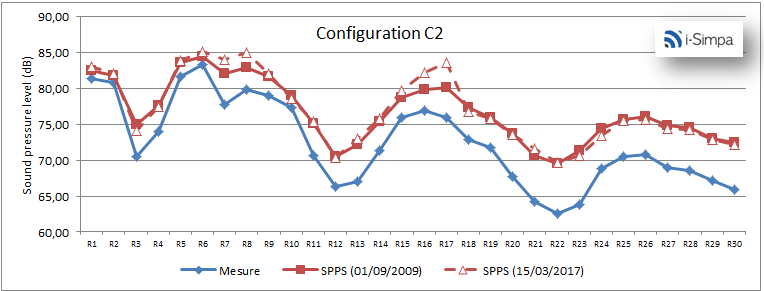
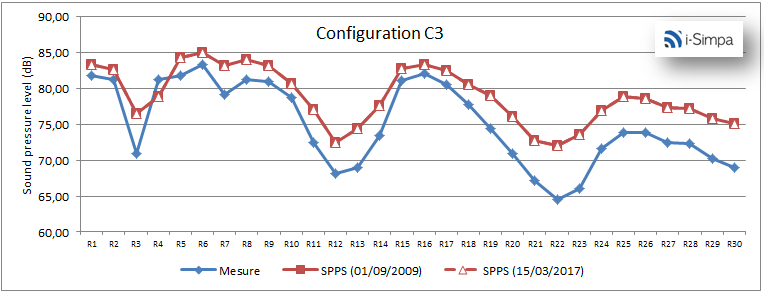
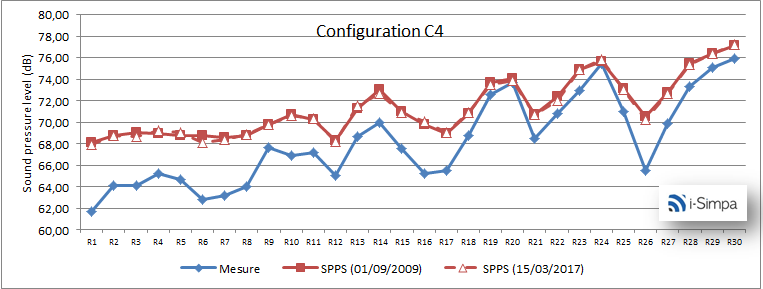
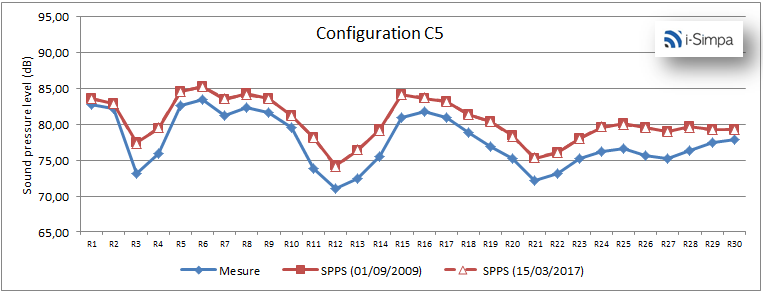
For all the 5 configurations (C1 to C5), the figures of the sound pressure level at the 30 receivers show a similar behavior between the SPPS results and the experimental data. However, we observe a "systematic" offset around 3-4 dB (overestimation of SPPS) with the reference data. Because, all results are given in absolute sound level (i.e. considering the sound power level of each source given in the reference article), one can assume a strong estimation of the source power of each source.
Sound pressure level (configuration C2)
Sound pressure level (configuration C3)
Sound pressure level (configuration C4)
Sound pressure level (configuration C5)
Calculation parameters
Reference
| Parameters | Value |
|---|---|
| Active calculation of Atmospheric absorption | YES |
| Active calculation of diffusion by fitting objects | YES |
| Active calculation of direct field only | NO |
| Active calculation of transmission | NO |
| Calculation method | Energetic |
| Limit value of the particle extinction | 5.0 |
| Number of sound particles per source | 1 000 000 (C1), 100 00 (C2, C3, C5), 300000 (C4) |
| Number of sound particles per source (display) | |
| Random initialization number | |
| Receiver radius | 0.31 |
| Simulation length (s) | 3.00 |
| Time step (s) | 0.005 |